When you look at a lithium-ion battery’s datasheet, you’ll often find two important graphs — the discharge curve and the charging curve.
To most people, these look like wavy, complicated lines.
But in reality, they are the battery’s heartbeat — showing how it performs, how long it lasts, and how safely it operates.
In this guide, we’ll walk through how to understand these curves easily — using examples and eight clear visual charts.
1. The Discharge Curve — How a Battery Behaves During Use
The discharge curve records how the voltage drops over time as the battery delivers energy.
It helps you see how stable the power output is and how much usable capacity you get.
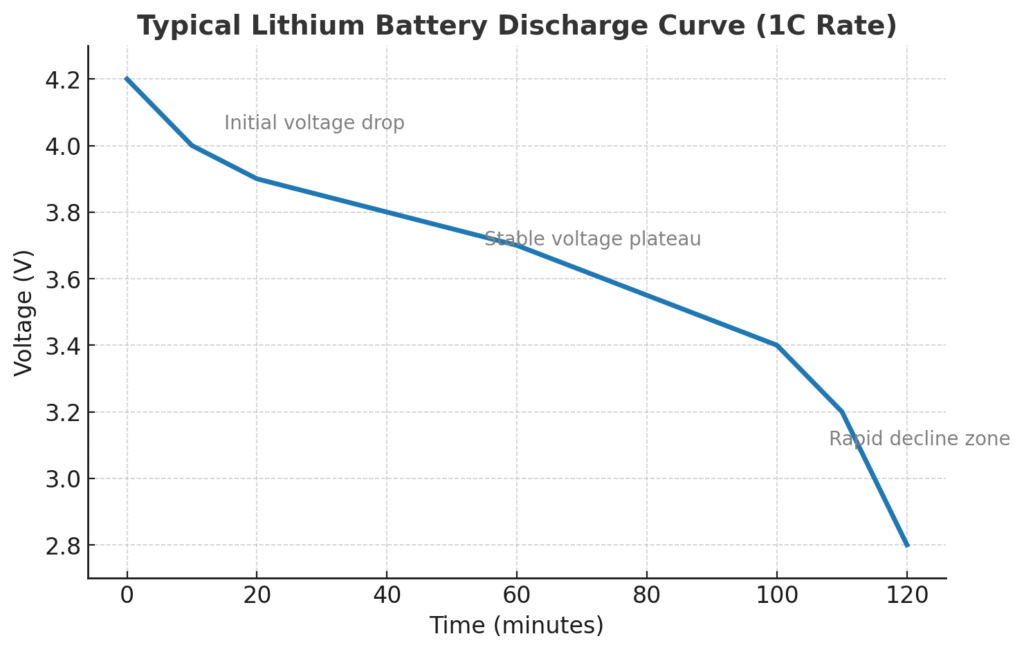
A typical lithium-ion discharge curve can be divided into three clear stages:
Initial voltage drop: voltage falls quickly from 4.2 V to around 3.8 V at the start.
Stable plateau: voltage remains steady around 3.7 V — this is the most efficient part of discharge.
Rapid decline: voltage drops sharply near the end, indicating the battery is nearly empty.
The flatter and longer the plateau, the more stable and reliable the battery.
2. Effect of Different Discharge Rates (C-Rates)
The term C-rate describes how quickly the battery is discharged.
A 1 C rate means it discharges fully in one hour; 2 C means in half an hour.
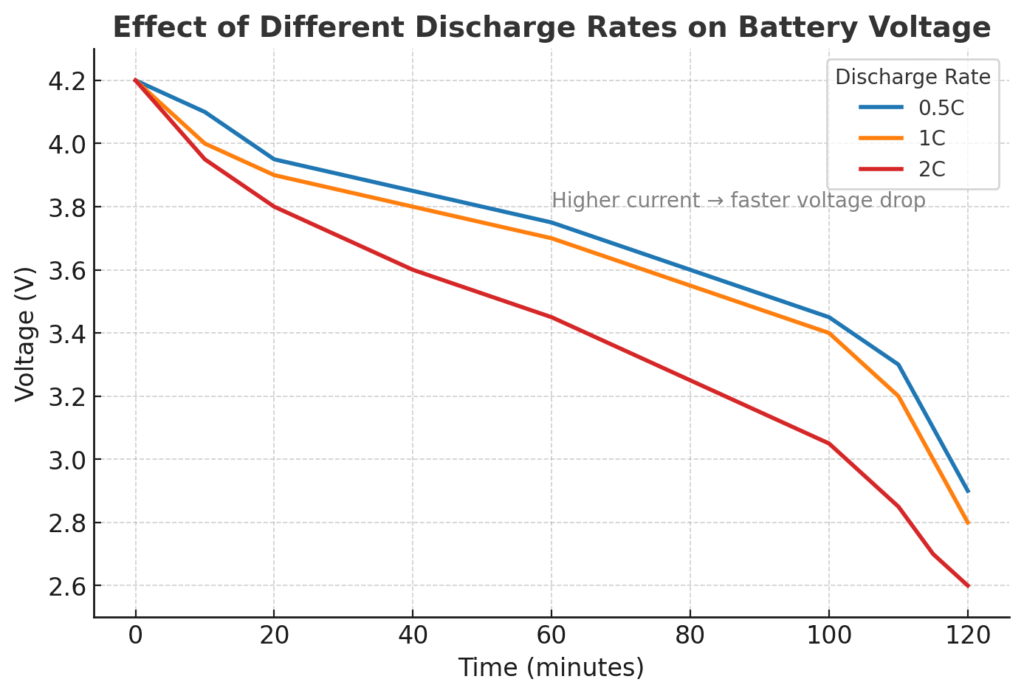
From the comparison you’ll notice:
At 0.5 C, the voltage drop is gentle — more energy is usable.
At 1 C, the curve is balanced.
At 2 C, the voltage falls faster and ends earlier.
Higher discharge currents cause earlier voltage decline and lower effective capacity.
This is why high-power devices tend to get shorter runtime even with the same battery size.
3. Temperature’s Effect on the Discharge Curve
Temperature plays a huge role in battery behavior.
Cold makes the battery sluggish, while heat boosts performance — at a cost.
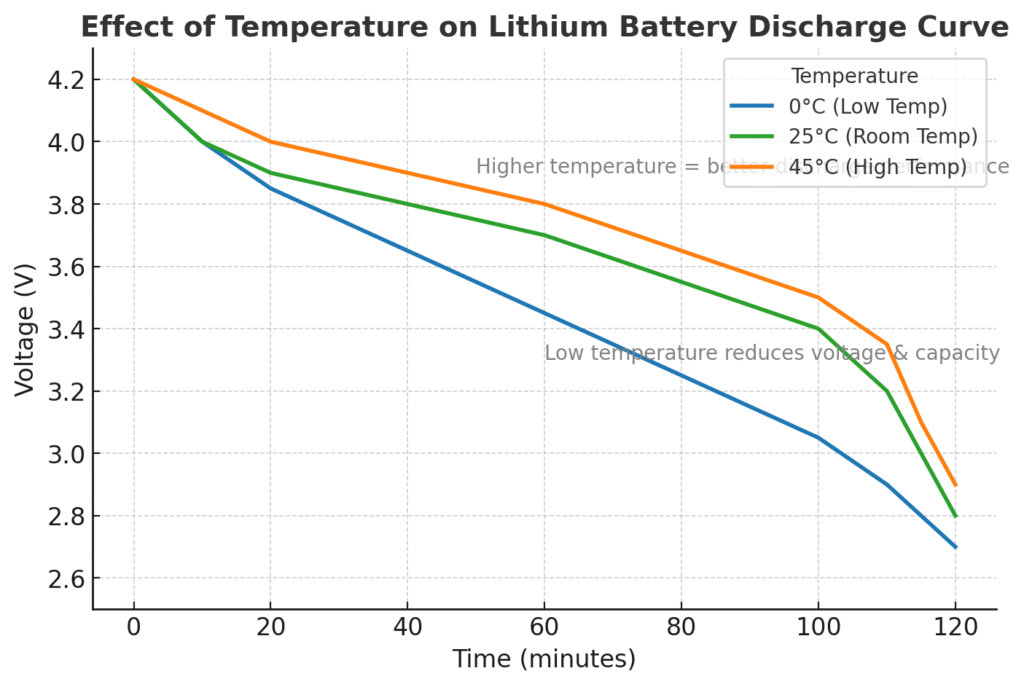
At 0 °C, internal resistance increases and voltage drops faster; usable capacity shrinks.
At 25 °C, performance is optimal and stable.
At 45 °C, voltage stays higher for longer, but excessive heat can accelerate aging.
So, low temperature reduces capacity, and high temperature improves discharge temporarily but shortens lifespan.
4. Cycle Aging and Its Impact on Discharge Performance
Every charge and discharge cycle slightly wears the battery.
After hundreds of cycles, voltage stability and total capacity decline.
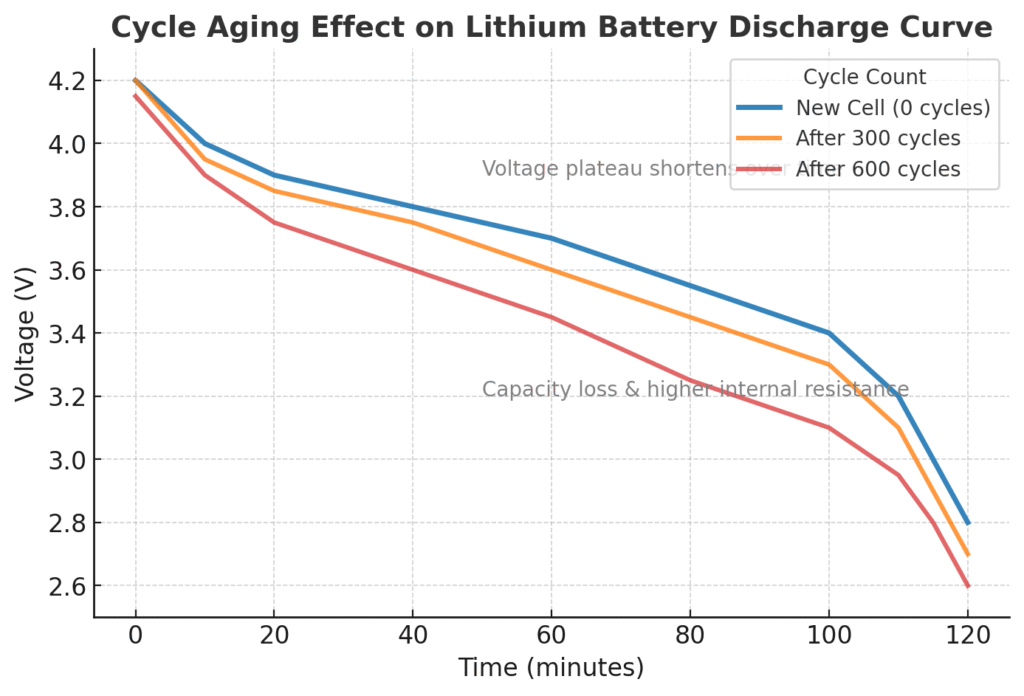
You can see the difference clearly:
The new cell has a flat, stable curve.
After 300 cycles, the plateau shortens a bit.
After 600 cycles, voltage falls earlier and faster.
This means that as the battery ages, internal resistance rises and it releases energy less efficiently.
5. Charging Curve — How the Battery Refills Energy
The charging curve shows how voltage and current change while the battery recharges.
Most lithium-ion cells use the CC–CV (Constant Current + Constant Voltage) method.
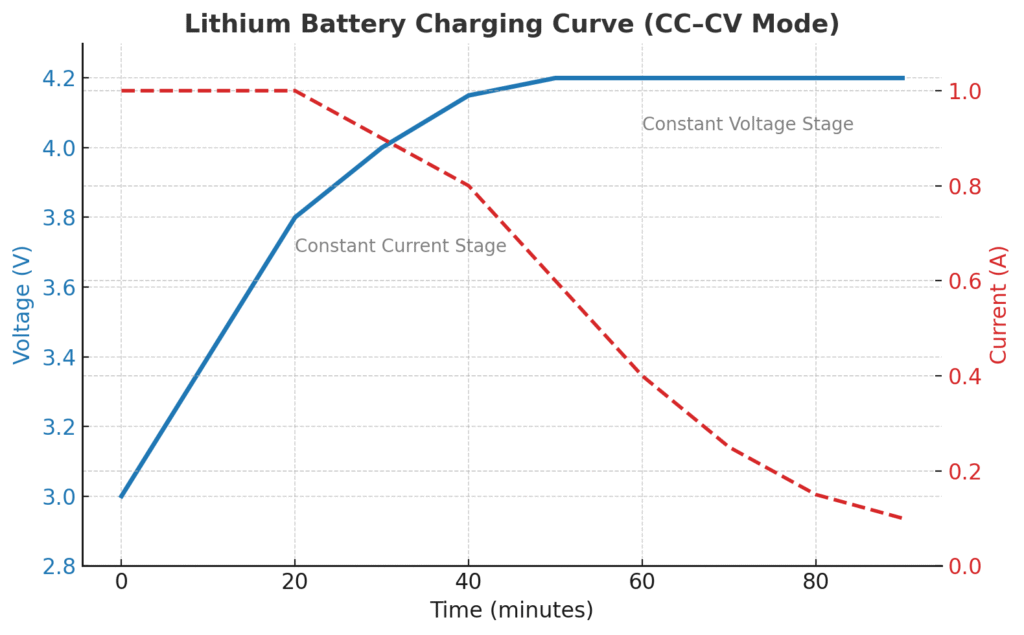
There are two stages:
Constant current stage: the charger delivers a steady current; voltage gradually rises from 3 V to 4.2 V.
Constant voltage stage: once voltage hits 4.2 V, current slowly decreases until the battery is full.
Even when the voltage looks “full,” the cell is still absorbing the final bit of energy during the tapering current phase.
6. Different Charging Currents and Their Effects
Charging speed has trade-offs. Faster is not always better.
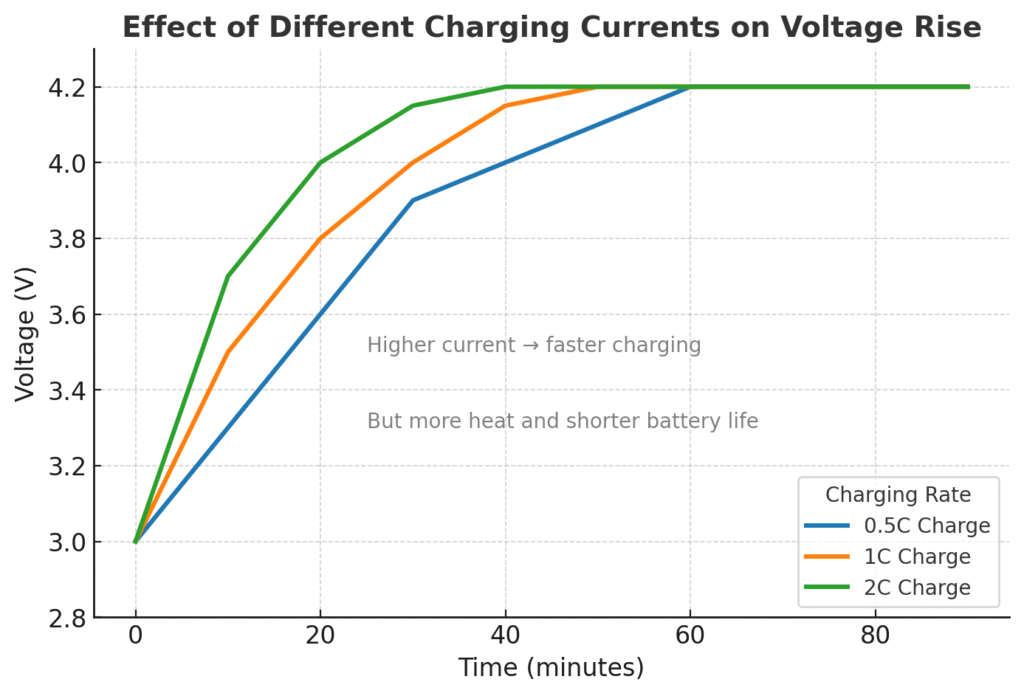
0.5 C charging is slow but gentle, ideal for longer lifespan.
1 C gives a good balance between time and temperature.
2 C charges quickly but creates more heat and shortens cycle life.
For energy-storage systems or long-term applications, moderate charging current is usually best.
7. Full Charge–Discharge Cycle Overview
To see the whole picture, it helps to look at charging and discharging together.
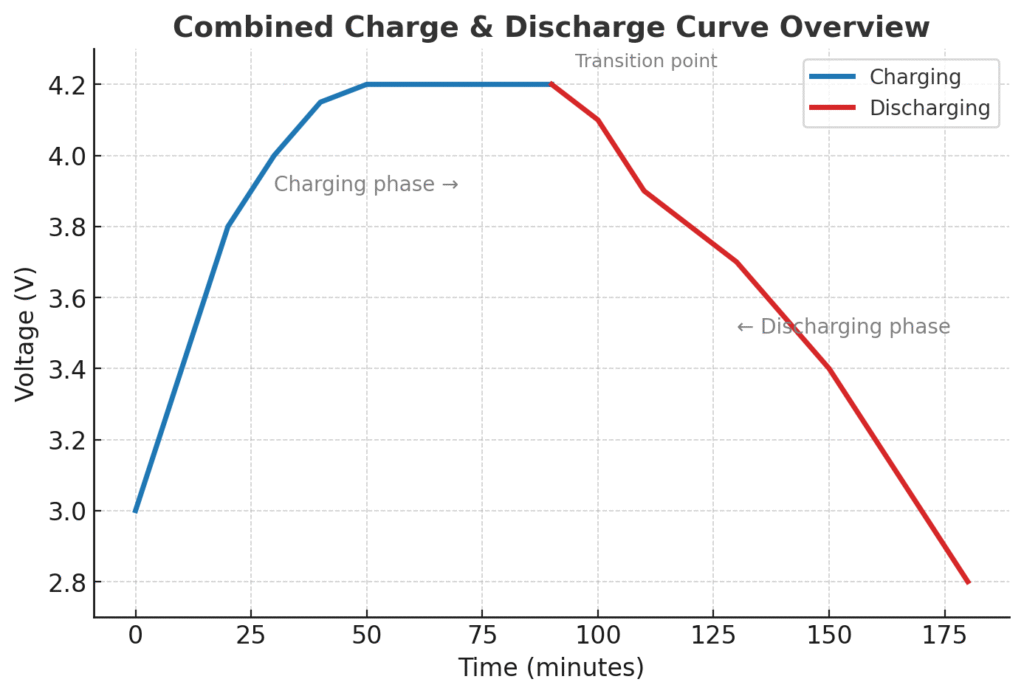
On the left, the blue line shows charging: voltage rises from 3 V up to 4.2 V.
On the right, the red line shows discharging: voltage drops back down as the battery powers a load.
Together, they form a complete energy cycle — the path from empty → full → empty again.
This visual comparison helps engineers evaluate round-trip efficiency and energy loss.
8. State of Charge (SoC) vs Voltage
One common misconception: voltage does not linearly equal capacity.
A battery’s voltage may stay almost constant while its stored energy decreases.
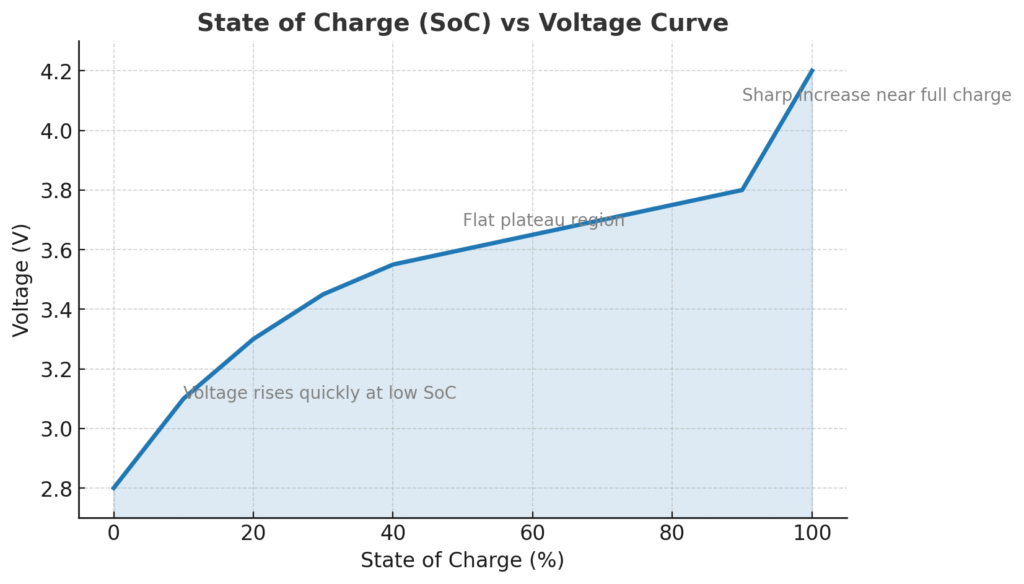
From 0 – 20 %, voltage rises quickly.
Between 30 – 80 %, voltage remains almost flat (the “plateau”).
Above 90 %, voltage rises sharply near full charge.
This explains why devices relying only on voltage often misread remaining battery percentage —
you may see “50 % left,” but it can drop to zero suddenly.
Conclusion
The charge and discharge curves of a lithium-ion battery are more than just lines — they are the true reflection of its health and performance.
From the eight charts above, we can conclude:
A flatter discharge plateau means higher quality and better stability.
High temperature or current improves short-term output but speeds up aging.
With more cycles, capacity shrinks and voltage drops earlier.
Voltage ≠ capacity — always consider the SoC curve for accurate estimation.
Whether you’re designing a product, managing a power system, or simply want to understand your battery better,
remember this rule:
Reading the curve is understanding the battery.